What motivates the shapes of our surfboard is the wave! The flow speed perceived by our board is the main source of planing, because the planing force evolves with the square of this speed. We will be able to collect in this chapter the information necessary for the evaluation of the speed in a wave of surfing.
WAVE FORMATION AND SPEED CHARACTERISTICS :
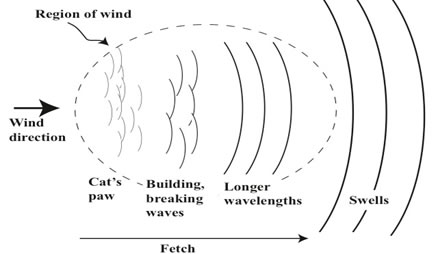
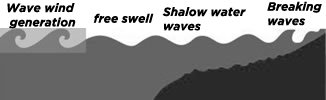
formation of the swell according to (Bascon, s.d
The surf wave results from the swell. The formation of the swell goes through three stages, the local deformation of the surface by the wind, the accumulation of these deformations over a distance swept by the wind, called fetch, generating a formed sea, and the propagation of the waves outside the windy area called a swell or swell. The swell is made up of waves of the same height and period that move in groups. The period being the duration between two passages of crests and the wavelength the distance between these crests. The swell can travel thousands of kilometers in deep water with very little loss of energy.
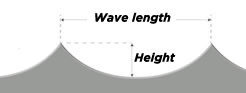
The swell forms a sinusoidal wave whose length is approximately 1.6 times the square of the period T in seconds: L = 1.6 x T² (T in seconds and L in meters). Waves of long period, therefore of long wavelength, contain more energy, this energy varies as the square of the period. In deep water, the speed C (m/sec) of the wave is given as a function of the wavelength L by the Equation::
Equation 1: C = sqrt (9.81 L/ 2π)
with π=3.14 we can roughly calculate V(m/sec) =1.56 TWe can also use the simplified formula: Speed (Km/h) = 5.6 T. Example: a weather forecast announcing a swell with a period of 10 seconds gives waves of 1.6T²=1.6x10²=160 meters in length between crests, moving at 5.6x 10 = 56 km/h.
But be careful, to predict when the waves coming from an offshore storm will start to arrive, it will be necessary to take into account the fact that in deep water, the swell moves in groups of waves half as fast as the waves which constitute them.
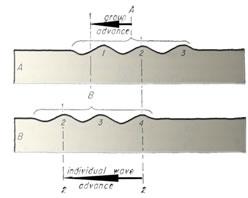
This phenomenon is explained by the energy consumption at the front of the group to raise the first wave, this energy will be restored at the end of the group by the appearance of a new wave: When the center of the wave group moves from A towards B, the waves that make it up move twice as fast. The wave (1) therefore comes to die on the front of the group while a wave (4) appears at the tail of the group. Our waves of speeds 56 km/h move across the ocean in a group evolving at 56/2=28 km/h.
Formation of the surf zone: The behavior of the swell is modified when the bottom approaches the surface at a depth less than half the wavelength L (wavelength). The peak velocity slows down and loses its relationship to the period as the bottom approaches. The waves of period 10 seconds of our example, moving at 5.6*10=56 km/h, which arrive close to the edge slow down to a speed dependent on the depth D (Depth).
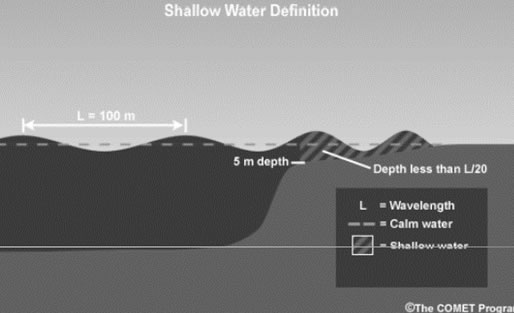
waves in shallow water (H.Quetelard
The peak speed C in shallow water (Depth less than L/20) is described by the Equation:
Equation 2: C =sqrt(9.81 x d) With C peak speed in m/sec and d depth in meters..
It follows from this definition that: at a given shallow depth, all the waves move at the same speed regardless of the period. The peak speed becomes proportional to the square root of the depth. A breaking far from the edge, corresponding to a significant depth implies a rapid crest displacement Waves which break on great depths, have high crest speeds which require to be towed by a jet ski to reach the speed necessary for the peak. Another consequence of the crest speed slowing down as the depth decreases, is that the speed energy of the swell does not disappear, it is transformed into wave height: the faster the wave arrives on a shoal, the more the speed variation is important, and the more the rise generated by the deceleration is important. The wave expels excess velocity energy by increasing the height of its crest. The wave stiffens and its slope increases until breaking. If we remember that the crest speed offshore is related to the following period T: V(m/sec) =1.56 T, we see the importance of the "period" parameter of the wave: A swell of 1m offshore at A 10-second period is perceived as "bigger" than a swell 1m20 offshore with a 5-second period, because the reduction in speed is greater and the transformation in height when approaching the bottom will be all the greater. Wave recorder data (buoys, fitted with a wave height measurement system, installed off the coast) Real-time swell information can be consulted on the net, on surf report sites such as allosurf.net for example.
Voici un graphique montrant la variation de vitesse (m/sec) de crête en fonction de la période en secondes, de la Here is a graph showing the variation in peak speed (m/sec) as a function of the period in seconds, of the swell following bottom heights (h in meters) varying from 0.1 to 40 m :
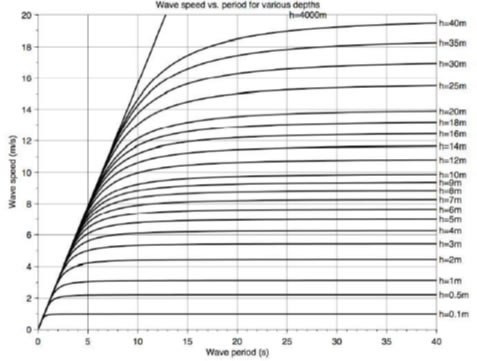
wave speeds as a function of period and depth (French
Here are two graphs showing an average of 57,000 measurements of height and periods, taken from 2013 to 2016 off St Jean de Luz (depth 20m) by the center for maritime and fluvial technical studies(Cetmef):
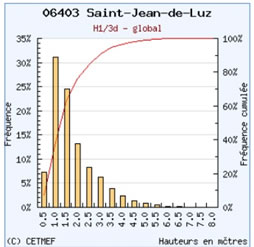
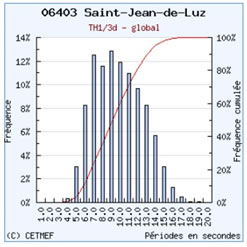
Cetmef
We can see a predominance of waves height between 1 and 1.5 meters and periods mainly between 6 and 13 seconds.
THE BREAKING WAVE AND ITS RISING FLOW:
Water particles are not transported by the traveling wave. The trajectory of the particles set in motion by the passage of the wave is circular in deep water and elliptical when the bottom approaches the surface. The term "upflow" is used here to describe the trajectory of the water in the phase where the wave rises, it represents the trajectory of the particles from the base to the wave crest. The concept of rising flow is particularly suited to the description of hydrodynamic phenomena in a frame moving with the wave.
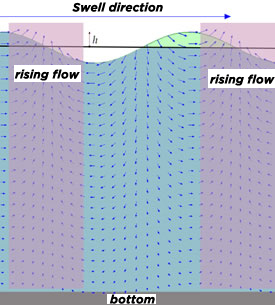
movements particles rising flow
Breaking occurs when the depth between the calm water level and the bottom reaches 0.8 to 1.3 times the wave height (the exact value is a function of the bottom slope, swell height and wave length) . The elliptical trajectory of the water particles generates horizontal velocities at the top of the ellipse, which become greater than the propagation speed of the swell. This elliptical trajectory generates specific relative speeds at the time of breaking: the relative speed between the projected lip and the flow at the base of the wave is twice the speed of the swell:
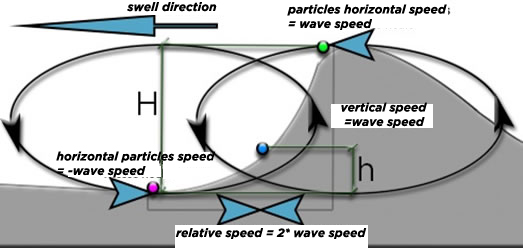
relative speed of the rising flow
Knowing that the speed of the wave in shallow water is: C = root (9.81 xd) With C peak speed in m/sec and d depth in meters, If we take the elevation as a fixed benchmark, the speed of crest of a breaking wave on a 4 meter bottom is approximately: Root (9.81 x 4) = 6.26 m/sec x 3.6 = 22.55 km/h..
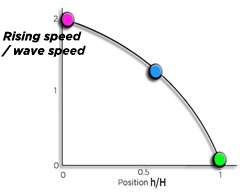
speed variation of the rising flow, relative to the surfer moving at the peak speed, at the 3 points of heights h/H of the previous figure
We can consider that an observer moving with the crest, then observes at the base of the wave, a "relative" rising flow, opposite to the swell speed. The surfer knows well this aspiration in the coming wave. At the bottom of these waves a suction effect resulting from the elliptical trajectories of the particles generates a speed opposite and equal to the speed of the crest. If we are thrown by the lip we perceive a relative speed at the bottom of the wave, which can reach twice the peak speed, i.e. 12.5 m/sec x 3.6=45 km/h.
In the vertical zone, the rising flow is substantially equal to the speed of the swell. The relative flow perceived by the surfer following the wave is therefore composed of 2 speed vectors: Relative speed vector = Upflow speed vector + Trajectory speed vector.
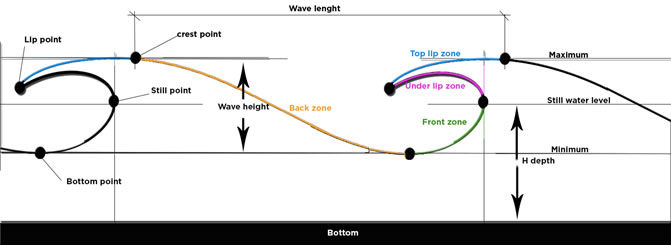
To end this brief description of the swell and the waves, let us name here various zones and points which we will serve as benchmarks for the following :